An easier way to auto-remediate memory leaks on Kubernetes!
Introduction
In the world of Kubernetes, being able to keep a constant check on the resource utilization of pods, and taking action when a certain threshold is breached, is important. With such power, you can automatically prevent outages, improve application performance, and increase system reliability.
In this blog, we will simulate a scenario where an application has a memory leak and gets killed every few minutes due to OOM Killed issue. We will configure a Prometheus alert to fire when the memory utilization exceeds the 80% mark and gracefully auto-restart the application. As a bonus, we will also discuss how to send a Slack notification with investigation details. Let’s dive in!
Let’s set the stage of our Problem
Simulate memory leak!
We are going to simulate a memory leak using a simple Python program
import sys
import time
import signal


def sigterm_handler(_signo, _stack_frame):
    # Raises SystemExit(0):
    print("SIGTERM received, exiting...")
    sys.exit(0)


def consume_memory(memory_mb):
    # Convert memory argument from MB to bytes
    memory_bytes = memory_mb * 1024 * 1024

    # Allocate initial memory
    memory_block = bytearray(memory_bytes)
    for i in range(memory_bytes):
        memory_block[i] = 0xFF

    # Add 100KB memory every second
    while True:
        sys.stdout.write("Allocating 100KB...\n")
        memory_block += bytearray(1024 * 100)
        time.sleep(1)

if __name__ == "__main__":
    # Read memory argument from command line
    signal.signal(signal.SIGTERM, sigterm_handler)
    if len(sys.argv) < 2:
        print("Usage: python memory_consumer.py <memory_mb>")
        sys.exit(1)

    memory_mb = int(sys.argv[1])
    consume_memory(memory_mb)
This simple script takes an argument specifying how much memory to consume (in MB) and then allocates the corresponding amount of memory, effectively simulating high memory usage. And then it adds 100KB of memory every second simulating a memory leak.
Deploy the Python script as a deployment
I have already built and pushed the image for the above Python script on dockerhub: “vikasy/robusta-memory-demo”. So you can just create a deployment using the below yaml.
We are using Deployment so that we can just delete the pod above a memory threshold and Kubernetes will take care of creating a new one.
---
apiVersion: apps/v1
kind: Deployment
metadata:
  name: myapp-robusta
spec:
  selector:
    matchLabels:
      app: myapp-robusta
  template:
    metadata:
      labels:
        app: myapp-robusta
    spec:
      imagePullSecrets:
        - name: dockerhub-vikasy
      containers:
      - name: myapp-robusta
        image: vikasy/robusta-memory-demo
        imagePullPolicy: Always
        resources:
          limits:
            memory: "128Mi"
            cpu: "100m"
        command:
          - python
          - /app/app.py
          - "105"
In the above yaml — we are assigning the pod a memory limit of 128 MB and the program will start with 105 MB memory utilization.
Define alert to catch the memory leak!
We are going to define a Prometheus rule using the PrometheusRule CRD.
apiVersion: monitoring.coreos.com/v1
kind: PrometheusRule
metadata:
  labels:
    release: prometheus-stack
  name: testalert
  namespace: default

spec:
  groups:
    - name: custom_alert.rules
      rules:
        - alert: memory_alert
          expr: |
            avg(container_memory_usage_bytes{container="myapp-robusta"}) by (pod) /  avg(kube_pod_container_resource_limits{resource="memory"}) by (pod) > 0.8
          labels:
            severity: warning
          annotations:
            summary: "Memory usage (instance {{ $labels.instance }})"
            description: "Memory usage is above 80% (current value is: {{ $value }})"
In the above definition we create an alert named memory_alert that triggers when the average memory usage of the container exceeds 80% of its allocated resource limit. Please note that the above alert rule is tailor-made for this demo and it won’t work for monitoring memory utilization in general — so please modify it before using it for your use case.
Now Let’s act on the alert automatically
I am going to use robusta for auto-remediation. Robusta is an open-source application for automated monitoring, alerting, and troubleshooting of Kubernetes clusters.
Before you go further you might want to get a brief idea of robusta here: https://docs.robusta.dev/master/.
Update Robusta Config
I’ll assume here that you have robusta installed on your Kubernetes cluster. Now let’s continue by adding the following in the generated-values.yaml file:
customPlaybooks:
- triggers:
  - on_prometheus_alert:
      alert_name: memory_alert
  actions:
  # Get the logs from pod
  - logs_enricher: {}
  # Get ps details from inside the pod which is exiting
  - pod_bash_enricher:
      bash_command: ps aux --sort=-%mem | awk '{ printf("%s\t%s MB\n", $11, ($6/1024)) }'
  # Now delete the pod and let it auto restart because we are using Deployment
  - delete_pod: {}
In the `customPlaybooks` section, we are defining what actions to take when a specific trigger occurs. In this case, our trigger is `on_prometheus_alert` and the corresponding alert is `memory_alert`. When this alert fires, it will perform a series of actions. The comment above each action defines what it does. Robusta provides these wonderful actions which make debugging super simple.
Next, we need to upgrade Robusta using the following helm command:
helm -n <robusta-namespace> upgrade robusta robusta/robusta -f ./generated-values.yaml - set clusterName=eclectic -n <robusta-namespace> upgrade robusta robusta/robusta -f ./generated-values.yaml - set clusterName=eclecticAfter upgrading we reload the playbooks:
robusta playbooks reload - namespace <robusta-namespace>Show me the magic!
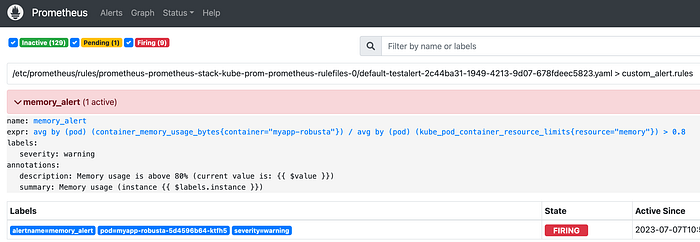
If all works well — you should see the memory_alert firing on your Prometheus within a minute!

In the end, you’ll see something like this on your Slack channel. You’ll receive an alert with all the details including the ps command output and the pod logs.


Also you’ll notice that a new pod will restart automatically.
~ ❯❯❯ kubectl -n default get pods | grep myapp-robusta                                                                                                                                                           ✘ 1
myapp-robusta-6895c56897-76l9m               1/1     Running       0             30s
myapp-robusta-6895c56897-sftct               1/1     Terminating   0             43s
Conclusion
Through this guide, we’ve seen how to leverage the power of Robusta and Prometheus to create an automated system that tracks memory usage and takes necessary actions when a set threshold is exceeded. This not only aids in efficient resource utilization but also ensures system reliability by preventing potential outages due to excessive memory usage.
Implementing this setup might seem a bit complicated initially, but once set up, it will provide a robust monitoring and response system that could be critical to maintaining the health and performance of your Kubernetes cluster.
What Next?
Robusta offers a bunch of other wonderful detection and remediation mechanisms worth exploring, you can check all of them here: https://docs.robusta.dev/master/index.html
You can also add an action for analyzing the memory utilization of the Python app — Refer to this tutorial https://docs.robusta.dev/master/catalog/actions/python-troubleshooting.html
